
Sunday, May 31, 2009
Summation update..
The summation index has been a good indicator of trend change in both directions lately though I've highlighted the Bearish case which obviously is my bias...

Saturday, May 30, 2009
What I think I see going on...
Friday had the feel of a blow off top which came about near the end of the day when the SPY creeped higher and touched the 200 day mva for the 1st time since the Bear market began. I think this triggered huge black box buy orders in the various stock index futures markets which was evident in the volumes. I also suspect that certain players anticipated this reflex and laid into the spike with massive sell orders, closing longs and even flipping over into new shorts. Monday could feel quite painful intra day with a cup and handle type break out look to it with confirming heavy volume but my money says it's a trap and that break out volume will actually be distribution selling, finishing with a lower close. This will also set up the first diverged RSI sell signal on the daily SPY chart since the March rally began. I still believe the dollar will begin trending higher along with bonds while stocks, pm's, basic materials will begin a trend lower.


Thursday, May 28, 2009
I'm seeing the top in gold and silver
getting a nice divereged RSI reading on an over extended rally in Gold and I believe we are heading for the high seven hundreds....


Tuesday, May 26, 2009
staying short
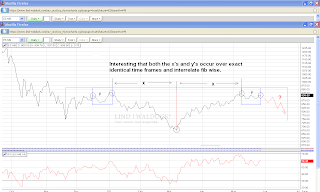
I remain short until the globex highs of May 7th get taken out. Interesting how time frames between highs and lows remain interrelated fib wise as highlighted in the chart below...

Monday, May 25, 2009
What's going on with Gold ?
Two months after QE "printing" and a sharp sell off in the dollar this is the best gold can do ? I think Gold is about to put to rest this whole inflation nonsense within days if not hours....


Dollar bounce on deck
The technical chart picture of UUP suggest we will see a bounce in the Dollar this week and I'm hoping it gets started as soon as Tuesday which also lends support to the Bearish charts in SPY, GLD and SLV...


Friday, May 22, 2009
seeing more head and shoulders set ups
Lookking at the SPY on an intraday basis I'm seeing another head and shoulders pattern with confirming sell sided pressure revealed as we rolled over the right side of the head. This suggests that the trend has turned and will be confirmed as we break the neckline on increased volume as per the chart below...


Thursday, May 21, 2009
IYT transports looking ready to make a move

The IYT trasports index in the chart below appears to be developing a head and shoulders pattern and a glance at the OBV picture confirms the increased sell side pressure as is obvious on the right side of the head. Sometimes this kind of indication can be used to jump the gun ahead of the actual break of the neckline.
Looking for a spot to short the 3x long bond bear etf
the TLT chart looks to be compressing the coil spring with a potential launch higher next week going into that mega billion dollar bond sale. My plan is to short the 3x 30year bond bear etf TMV and hopefully with a nice tail wind from a stock market sell off somewhat as sketched in the chart below...


Wednesday, May 20, 2009
Looking for a test of 900 on the /ES
I'm expecting a retest of 900ish on the /ES and hope that we can blow through it and get a nice deep pull back...


Tuesday, May 19, 2009
That fractal chart tried one more time...
This idea isn't completely off the table just yet and while I'm short, I recognize the potential to run up into that 200 day moving average which would actually provide some beautiful technical sell signals in lots of groups. In the mean time if this market opens up and craters I don't want to be on the sideline twiddling my thumbs so I'm keeping tight stops and looking for a good hold along the way to short from..


GS looking ripe to get slapped back
For the first time since the lows of mid November GS is flashing an RSI sell signal on the daily basis and I've gone short small....


Monday, May 18, 2009
another indicator...
another indicator that lends support to the idea that we will correct lower at least for the next day or two is closing $tick value. Overlaying 90min. ticks on the spy chart reveals how the signal works. This supports my thoughts that we will trace out a flag type affair over the next few days...


Looking for some sort of flag situation
I can't see us pushing up and breaking out to new trend highs with RSI tilted lower and so I see the most likely scenario will be a wide ranging flag type set up before we head lower as per the chart below...


staying with the trade for now...
ok we went a little further than I expected but I'm still believing that we are only correcting the first move down and should begin to fade and roll over right in here...


flipped short again at 901ish
Don't forget this is what's happening in the background so don't get too bullish here.


I suspect we drift higher up into 900ish
I'm expecting we drift higher up into 900ish on the /ES in order to take some of that edge off of the divergent RSI before we turn things back down...


Friday, May 15, 2009
Caught my eye....
Two similar Bear market rallies in different time and price scales but exhibiting similar correction type waves hmmmm.....


Back to that line chart..
Updating the closing basis line chart looks so far today that we've clearly broke down under support. Only a ramp back over 892ish will tuck it back inside the channel...

Looks like maybe that was a key reversal sell with supporting bearish RSI in that HYG chart.. I think I'll hold short into the weekend


Looks like maybe that was a key reversal sell with supporting bearish RSI in that HYG chart.. I think I'll hold short into the weekend

Thursday, May 14, 2009

covered longs thinking short again
I'm out of my overnight /ES longs and seriously thinking about getting short again..
EDIT: short small 895.00..

EDIT: short small 895.00..

Wednesday, May 13, 2009
Not a bad spot for support to come in
Got stopped out on the Globex failure and stayed neutral until it appeared that 880ish was going to hold.. went long again small in the Globex session looking for a drift higher. The chart suggest that 880ish should be a good support level for another attempt higher with RSI oversold while price is being support at an important fib level...


Tuesday, May 12, 2009
SPY obv pressure
As is highlighted in the SPY chart below there has been more participation on the up moves vs. the down moves as indicated by the circled valleys. I'm looking for one big exhausted volume day Thursday or Friday with a lower close to confirm the top is in....


Looking for a Globex ramp
I'm long again looking for a manipulated Globex ramp into tomorrow morning and a continuation rally higher marked with a closing high. Would like to stay long into thrusday and flip short intra-day as we pin the 200 day moving avg. I am trading on the idea that this will mark the top of the Bear market rally....


bidding it up off the bottom again
I've covered shorts and now long small but ready flip over in a heart beat... not liking this pattern of pulling it off the bottom before channel price objectives are met. I suspect we may get a closing high tomorrow with a tail the pins the 200 day movning avg. thursday or friday marking the top of this corrective bounce..
EDIT: ok I'm back out for a quick 8 points.. will wait to get long early in the Globex session this evening.
EDIT: ok I'm back out for a quick 8 points.. will wait to get long early in the Globex session this evening.

Monday, May 11, 2009
looking for /ES 890 and then....
Things seem to be set up for a dive down into the 890ish area by tomorrow afternoon but then there is the chance we take one last stab at the 200 mva. I'm positioned short and will be watching to see how they defend that area.
On the daily chart below I've sketched out how things may play out this week. If 890ish is defending and we ramp into opex as the sketch suggests, then at that point RSI will be glaringly bearish as well a kiss of that 200 day moving average would trigger selling with closes coming at the low end of the daily range and finally Monday being extremely Bearish.


On the daily chart below I've sketched out how things may play out this week. If 890ish is defending and we ramp into opex as the sketch suggests, then at that point RSI will be glaringly bearish as well a kiss of that 200 day moving average would trigger selling with closes coming at the low end of the daily range and finally Monday being extremely Bearish.


Sunday, May 10, 2009
Globex set up
The Globex set up is encouraging as the techincals imply a test of the 910ish area. If we do come down to the 910ish area it would help shape the two high points on the longer term, 120min bar charts and increase the odds of us coming all the way back down to the 890ish area...


Saturday, May 9, 2009
Interesting channel possibility
sticking to my scenario but looking at it in another way, I notice that the price action has remained inside a wide channel which suggests an opportune time for a correction..


Friday, May 8, 2009
I'm staying short into the weekend
They took the market right up to the absolute limits of price where my signals would be canceled out. My sense is that Monday is going to be down big.
Looking for a lower close this afternoon
I'm looking for a close below yesturday's close followed by weakness mid next week before taking another shot at the highs....


Thursday, May 7, 2009
sketching the potential
Being one that relies a lot on RSI signals, I'd love to see us cave in down into the 875ish range before turning back and kissing the 200 day moving average in such a way that RSI screams to double down on shorts.. I'm position in FAZ, SMN and SRS and would love a chance to add on a retest of the highs as sketched in the chart below.

..
Was looking for a key reversal type day in the stock market but it appears as though it may have showed up some place I was not expecting...


..
Was looking for a key reversal type day in the stock market but it appears as though it may have showed up some place I was not expecting...

Looks like 887ish might still come
Looks to me like 887ish might yet still come but if it does today's key reversal idea is out and may very well set up a high coming in around the 13th at 947ish accompanied with a glaring RSI daily sell signal and a pin through the 200 day mva ...
EDIT: if we can get it down to 890.00 I'll seriously consider getting long small and short term into the Globex session

EDIT: if we can get it down to 890.00 I'll seriously consider getting long small and short term into the Globex session

Wednesday, May 6, 2009
Sketching in the action
I'm sensing the final blow off top coming on tomorrow's jobless claims / stress test release. I'm visualizing a pin through the 200 day moving average followed by late day selling into the close. Expecting Friday trading to be weak ahead of the weekend and come Monday a sharp move down. I've started getting short this afternoon via purchases of SMN and SRS and planning to get into FAZ tomorrow as the market nears the 200 day moving average.


Tuesday, May 5, 2009
holding out for a fill @ 887ish
Still looking for that 887ish area in the coming hours, perhaps late tomorrow morning for a spot to get long small up into the stress test ramp..


Monday, May 4, 2009
Looking for a small pull back
Things are unfolding faster then I had expected and got caught short trying to micro trade ugh.. now I'm looking for a small pull back to flip and get long this blow off up into the 940ish range as per the sketch below...


looking to get out and flip long from 887ish
Market is just ripping and tearing.. looking for a chance to cover my shorts on a test of 887ish and flip long for the final blow off into the stress test release...


shorts back on
Ok went long last night after the shorter term negative RSI signal was over run only to wake up and see a new one form which causes me to flip short again with the hope that 870ish is doable.


Sunday, May 3, 2009
expecting a test of the highs short term
Covered my shorts as it looks like they plan to run it up perhaps slightly above the most recent highs 890ish between tonight and mid-day tomorrow. I expect this will fail and cause a quick brief correction down to that 860ish area before moving on to low mid 900's. I'm placing sell limit orders on /ES at 887 hoping to get tripped sometime before 9:30am tomorrow.


Long term $TNX target
Thought I would throw up a long term technical chart of $TNX going back 30 years which reveals the unique behavior of it's price action. I think we can easily expect 4% over the intermediate term. The argument will be is Bernake's quantitative easing failing or is this safe haven money unwinding and pouring back into stocks?


Friday, May 1, 2009
Fib works revised
I noticed that the stress test day (May 7th) falls at an exact equal fib 1.382 days of the initial leg X and would mirror leg Y of the correction. Assuming the market launches higher on the release of the news and closes on the highs would potentially allow for Friday the 8th to intra-day pin the 200 day moving average, or come very close to it. I would expect the market to roll over and close at the lows on massive volume forming a key reversal and marking the beginning of a new leg down as per the charts below.

Sketching the above scenario in, stepping back and visualizing the setup, looks harmonious and balanced and my trading will be towards that outcome unless the market tells me otherwise. As per the chart below..

Another interesting situation that has developed is in the high yield bond etf JNK which is now flashing another bearish divergent RSI signal which would help confirm a new leg down in the equity markets if it plays out.

Interesting ending but I remain undetered
Still looking for that lower fib to get hit Monday or Tuesday.. this end of week short covering clean out should help collapse price action down to my target.


taking my points off and flipping to the short side
seeing a nice bearish divereged RSI situation and looking timed to send things into the weekend on the weak side... looking for back down to 860ish


Subscribe to:
Posts (Atom)
