
Friday, October 30, 2009
SPY weekly
The weekly chart stepped up and over ruled the whip action in the daily chart and now has a minimum price objective of 101.98 but I suspect with the speed of the decline and increasing volume accompanying it that the gravitational pull of the 200 day moving average has taken over and demands a revisit of price...

Thursday, October 29, 2009
SPY thoughts..
I'm looking for a wide and volatile flag type affair in the SPY in the coming days while the weekly charts still have a bearish look to them...


Wednesday, October 28, 2009
$SPX techincals
I still believe the failed head and shoulders break out which sparked the last few months of rally needs to be revisited partly because you would expect a huge surge of volume on that kind of move which did not occur. Also the slower 14 day RSI has flashed a sell signal which is confirmed by the diverged OBV and I noticed that of the 4 recent roll over dips the previous 3 occurred with negligible volume and this last one was accompanied with 6 straight days of heavy volume. Lets not forget price has pulled to record distance from the 200 day moving average which is set to exert it's gravitational pull on the market....


Tuesday, October 27, 2009
HD head and shoulders
Home Depot looks to be setting up a head and shoulders pattern and using OBV to gauge the internal volume flow confirms and supports the idea that the neckline will break to the downside...


Monday, October 26, 2009
Looking for a lower close on the weekly $SPX
I lower close on the weekly $SPX chart will solidify an RSI sell signal and mark the beginning of a more substantial trend change...


Sunday, October 25, 2009

Friday, October 23, 2009
it's still early but..
given the look and feel to the transports and the NYSI I don't see how they can close today to the plus side.. seems more how low can it close if anything...


Wednesday, October 21, 2009
SPY action..
I'll be looking for follow through selling on heavy volume to confirm a 2 day key reversal type move with a 1st target coming in the zone of the 200 day moving avg...


Tuesday, October 20, 2009
gold and the dollar...
It appears that both gold and the dollar are flashing warning signals to the equity markets. The below chart shows the coiled RSI set ups in both GDX and UUP....


Monday, October 19, 2009
RKH RSI
the regional banking index is holding in with a nicely divereged RSI sell signal and now it looks like ZION bank should get the ball rolling to the downside despite the AAPL party...


Saturday, October 17, 2009
Elliott wave thoughts....
I'm considering the idea that wave 3 and 5 both threw over the channel based on a combination of fed pumping, corruption in analysts buy recommendations leading to the tech wreck, more fed pumping after 9/11 with more rating agency corruption leading to the housing crash and now a finale desperate fed pump that has only brought us back up to test the upper channel line. (labeled wave B) which suggests a collapse on deck (wave C) which takes us down through the lower channel line by late summer or early fall of 2010....


Friday, October 16, 2009

Wednesday, October 14, 2009
GLD plays off the plunge in the dollar...
Interesting action in GLD despite the deep plunge in UUP...


Monday, October 12, 2009
SPY looking weak..
going into the fall season SPY appears to be flashing sell signals as it edges higher with both RSI building a bearish coil and OBV not confirming the move up. Notice how OBV held firm with a higher low in July before the launch higher. This time I'm seeing the opposite..


Sunday, October 11, 2009
potential SPY channels...
This appears to be as good a level as any to mark a turn lower on the SPY short term regardless of whether this is a new bull run or a topping of the downward channel...perhaps a cross roads while the dollar is coiling for a surge higher..


Friday, October 9, 2009
geometric visuals..
stepping back and searching for some geometric proportion derived off parallels tied to the major trend channels reveals one possibility that we are pressing against an upper channel in a bull trend and may need to test the low end of the range. I'm not a bull but perhaps at the least we are do for a correction..

Thursday, October 8, 2009
SPY OBV
The SPY which has broken below the long term uptrend line may be forming a topping upward skewed head and shoulders pattern with the way the volume is playing out on OBV...


Dollar looks like it's about to explode north...
Looking at the dollar through UUP I'm seeing the potential for one more intra day low followed by a higher close that would mark the intermediate low for the dollar..

ALso I'm seeing the potential for a substantial move lower in the energy sector through OIH which reveals a divergent RSI on the break out higher that occurred on negligible volume, not what you would expect on a break out...


ALso I'm seeing the potential for a substantial move lower in the energy sector through OIH which reveals a divergent RSI on the break out higher that occurred on negligible volume, not what you would expect on a break out...

Tuesday, October 6, 2009
SPY broken long term trend line..
with a retest of the line from underneath..

The first substantial negative divergence in the OBV also appeared with the break of the longer term uptrend line....


The first substantial negative divergence in the OBV also appeared with the break of the longer term uptrend line....

Sunday, October 4, 2009
Bonds and stocks dislocation...
It seems ever since the failed head and shoulders pattern on the spy, which mysteriously came on low volume, the bond and stock market have dislocated from their normal inverse relationship...


long term cycles in tax rates..
If one could apply ta to a long term chart of tax rates and assume there is a cyclical nature to it then the below chart courtesy of Dshorts.com, (which I have molested with crayon scribbles in order to help expose the correlation with stock prices) suggests that tax rates are about to spike higher to try to pay down the debt binge of the last 20+ years causing the stock market to struggle for the next decade or two...


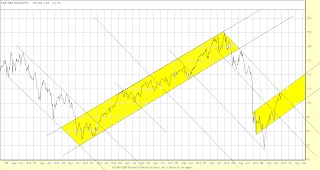
collapse speed..
One possibility is that we've collapsed too rapidly beyond a lower downward trend channel and the market needed time to catch up with a more orderly drain of funds out of the stock market.. something similar to the angle of descent during the tech wreck (yellow price channel). If so the next move should be down to an area that either defines a new point along a lower bullish trend channel, or worse, a move to new lows....


Friday, October 2, 2009
intra day flag action...
I'm suspecting we are getting intra day flag action built on shorts coming out and chasing the offer while the OBV stays flatlined to down... looking for a weak close into the weekend...


Thursday, October 1, 2009
This time adding one word....
Adding one word (dow) search field, which is probably what the typical mutual fund/retail trader might use in comments spread out over the internet reveals a massive difference in the numbers....

Ok I should have refined the search by time frame. Looking back one week it reveals twice as many bullish hits..


Ok I should have refined the search by time frame. Looking back one week it reveals twice as many bullish hits..

A look back at an odd market turn...
I keep coming back to that failed head and shoulders break out that occurred at the 87ish area on the SPY and the volume action that occurred or didn't occur at that time and all the way up since then. As the chart below highlights every single market turn has been marked by a volume spike which one would expect to see. Oddly the one instance where no volume markers occurred is at that failed head and shoulders pattern, which one might expect to see the largest spike of all on the entire chart. My first target is 93-94ish on this down leg but I'm wondering if we are in fact riding on a giant air pocket and now need to retest that 87ish zone at a minimum at some point soon.


Subscribe to:
Comments (Atom)
