
Tuesday, September 29, 2009
Friday, September 25, 2009
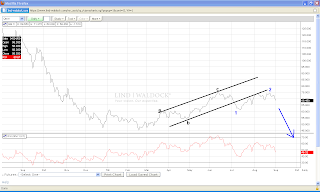
comparing the magnitude of the bounce vs. 03 bounce
just a quick cut and paste overlay of the current QE pumped Bear market bounce vs the 2003 bounce to get a sense of the unprecedented strength and steepness of the move...


Thursday, September 24, 2009
and yet another overlay lined up via calendar basis..
This time I'm overlaying the two periods based on the calendar basis...


The same 1939 fractal..
viewed this time with the current $SPX graph positioned above the 1939 chart action...


1939 vs 2009
searching for scale and proportion between the two post crash periods I discovered that measured from peak highs to 1st rally peaks came in at exactly 31.6% before rolling over into the fall season. If this turns out to be a good fractal then the 12.5% correction that followed would take us down to apprx. 940ish on the $SPX...


Monday, September 21, 2009
Looking for fractal lows..
This time setting up the $compq index with the 1938 dow suggests lower prices on deck..


IYG looks as good I time as ever for a turn..
Still short and very near a point where I will be forced to cover but IYG holds hope that a turn is very near...


Saturday, September 12, 2009

Friday, September 4, 2009
The Summation index weekly basis
appears to have finally established it's down side momo and is sure to take equities down with it. Combine that with the out sized spread of the S&P over the 200 day moving average and the RSI sell signal and those last few remaining bullish passengers loaded on the Bear bus it appears the market is now ready to head down for the next 6 to 8 weeks..

I like to use the weekly Summation index overlaid with the $NYSE in order to help reveal the shorter term cycles. In the below chart any time the summation index has clearly rolled over forming a peak (blue circled areas) the market then sells off and doesn't let up until it reaches the next cycle low bar. The bars are established by lining up swing lows in the summation index with the stock index. Observing the average time span between the bars helps in projecting when the selling may let off. As far as I'm concerned the SI peak has completed and we are now going down finally!

Looking at the recent action on the 120 min. bar chart it looks to me that the top is in at 1038ish with the first leg being corrected to the .618 fib zone which resets the RSI for the next down leg...

Thursday, September 3, 2009
GS on balance volume 1 minute basis...
The on balance volume in GS on a one minute basis over the last 3 days shows much heavier volume on the sell and what I suspect is shorts and market order buyers getting squeezed on the up ticks which reveals itself in the OBV highlighted in the chart below...

which leads me to suspect we are tracing out a flag type formation that will break down towards the low 150ies which when sketched out appears to have a good feel to the chart picture...


which leads me to suspect we are tracing out a flag type formation that will break down towards the low 150ies which when sketched out appears to have a good feel to the chart picture...

Wednesday, September 2, 2009
does someone know something ?
the below chart demonstrates the casual relationship between gold/gld and bonds/tlt and how they tend to move opposite of each other. I added the circles to highlight the semi mirror like action in prices. Notice the alarming ramp going on in both gold and bonds and the simultaneous sell off in equities that began yesterday into today.. hmmm does someone know something ?


Looking for 890 to 910ish..
Continuing with the broadening top outlook and calling for first target at the 200 day moving average area from 890 to 910ish before thinking about covering shorts...


Tuesday, September 1, 2009
encouraging action..
I'm still going with the broadening/megaphone top chart pattern on the S&P which though rare usually come at the terminus of powerful trend surges and once confirmed mark a change in trend. My first target is the dashed blue line which is called for by the RSI signal...

Crude continues for now to support the idea that the next leg down has begun. Using Elliott wave labeling I'm expecting new lows at a minimum...

Crude continues for now to support the idea that the next leg down has begun. Using Elliott wave labeling I'm expecting new lows at a minimum...

Subscribe to:
Posts (Atom)
