
Thursday, April 30, 2009
Fib works
Another chart a few days old that support my thoughts that at or around May 13th will mark a turning point in the market.

seeing potential @ 862ish
I'm long from 865 and watched that late day erosion take me mildly negative. I'll hold long hoping that the 50% fib of this recent move and bullish diverged RSI will help the market drift higher into the morning.

looking to test the long side
Looks like that 866ish intra-day might be a good long side test run on the back of that divereged RSI signal.


Wednesday, April 29, 2009
Looking to buy a dip down around the rising trendline
That was a nice ride higher though not breaking out and carrying on as I hoped. Was stopped out on the late dip @ 868. Now looking for a chance to get long again near that rising trend line in the 866ish range for another drift higher come morning. I'm still with a long sided bias up into my target area at 940ish.
EDIT: not touching this at 866... I'll wait for 860ish within a day or 2 to get long again.

EDIT: adding a sketched chart of the symmetry I expect will unfold which highlights the rounded turn higher as we proceed. This suggest a possible low of 860 at some point tonight or tomorrow.

EDIT: not touching this at 866... I'll wait for 860ish within a day or 2 to get long again.

EDIT: adding a sketched chart of the symmetry I expect will unfold which highlights the rounded turn higher as we proceed. This suggest a possible low of 860 at some point tonight or tomorrow.

Tuesday, April 28, 2009
Visualization of symmetry, scale, angles and time frames
This piece is a few days old but decided to throw it out there for those who have an eye for, and interest in market symmetry.


sketching in the action
I expect that any move that violates the 870ish highs will trigger massive short covering and margin calls such that a measured move up into the mid 920ies is possible. If things play out that way I will finally be able to start entering position trades on the short side.


looking to buy on any dip tonight
I'm looking to buy on a dip around 848 tonight on Globex but I shouldn't fuss over 2 /ES points. This at least gives me time to watch and think. I expect by tomorrow morning we drift up towards the top of the pattern and break out to the upside on the GDP report regardless of how Bearish it might be.


covered my longs stepping aside for a minute
not liking the RSI divergence for a minute getting neutral till things clear up.


Stopped out but going long again from 843
Got stopped out on that down leg this morning and re-entered long from 843 with a tight stop just outside the triangle that's forming, if it can be called that. I'm on the verge of bailing out on my upside targets if they can't hold things together today.


Monday, April 27, 2009
going long again for a move back up to the top
I'm long right in here from 852 and looking for a drift higher back up to the top of the range tomorrow.


Nice pop higher
Taking 14 points off the table and stepping aside for a minute.. seems to early to try to blow through the highs time wise.
If I had to guess the thing that will get us through the highs will be a surprise GDP number tomorrow, or maybe short covering on the release of a bad GDP number.. kinda the opposite of buy the rumor sell the news. If we correct half of this pop sometime this afternoon I may go long again looking for a close right at the highs as imagined in the below chart...

If I had to guess the thing that will get us through the highs will be a surprise GDP number tomorrow, or maybe short covering on the release of a bad GDP number.. kinda the opposite of buy the rumor sell the news. If we correct half of this pop sometime this afternoon I may go long again looking for a close right at the highs as imagined in the below chart...

Sunday, April 26, 2009
Looking to catch a long trade from 854ish tonight
Hoping a can get long from 854ish tonight if the price action settles down.
Edit: long from 854 small, tight stop just outside the channel
Edit: stops hit last night back in long from 850 for another go

Edit: long from 854 small, tight stop just outside the channel
Edit: stops hit last night back in long from 850 for another go

Proper orientation via basic techincals
My orientation remains long sided based on various tried and true basic weekly technical indicators. I have and will flip short on the shorter time periods and only enter long positions cautiously given these uncertain times. My target remains a slight breach of the January highs. Using time and price fibs I'm leaning towards a mid May peak around 940-950 range. This is an area where the 200 day moving average, RSI target signal is completed and cycles will begin pressuring the price action.


Friday, April 24, 2009
Marching onward and upward
Although I missed getting long from the Globex dip low of 842 overnight, which I had called for. I did get filled long from 848 and covered at the close of trading today. I don't want to get caught long during weekend lock up in the event of a sudden news item rocking the markets. My expectation is that we will open very strong Monday and hope to get a chance to re-enter long on any dip during Sunday night's Globex session. I'm looking for a measured move up away from the midway flag to 920ish in a day or 2 of trading followed by retest of the 880ish level. I'd love to see many days of indecision such that the last burst higher to 947ish will get caught glaringly divereged from it's underling RSI presenting the first fantastic shorting opportunity.


Thursday, April 23, 2009
I expect the flag formation to resolve to the upside
I'm expecting a shallow dip to the 842ish range before turning higher and breaking up out of the flag, tripping stops along the way. Hoping to get long small early tomorrow morning.


sketching the what if
The markets continue to march towards my target 950ish and I remain with a long sided bias


covered and out at 844 nuetral for the moment
Woke up and saw a nice rise in /ES and saw FTSE starting to look shakey after an initial pop and decided to cover for the moment.
Wednesday, April 22, 2009
globex target for the moment
Covered shorts from 852 at 836 and flipped over long into the globex.
At first I thought the low 800's would get retested but now I'm seeing a situation where we drift up into the 850ish zone. I'm long from 837 on globex looking to get a chance to dump at 850

At first I thought the low 800's would get retested but now I'm seeing a situation where we drift up into the 850ish zone. I'm long from 837 on globex looking to get a chance to dump at 850

looking for test of 800ish next
I'm looking for a run down into the next lower channel as far as 800 to 810 on the /ES


stopped out @349 back in short again at 352
stop was hit but went short again from 352 off of that bearish divereged RSI on the 5 min.


Tuesday, April 21, 2009
Back to the McCellan chart.
Sketching again.. ever altering and moving the daily bars around, doing the what if scenario with the McCellan oscillator and it's tendency to whip higher at major reversal areas, I present this idea.


Hopeful that the retrace has faded
I'm hopeful that the retrace back to 848 has stalled. The 848 represents both the 50% fib area as well as an area where the shorter term RSI's kiss the 70 level. I'm expecting we roll back over now and this time test that rounded 800 level. Hoping that it holds and we drift our way back up to the highs and beyond, all within a larger Bear market.


out at 841 looking for it to roll over right in here
got stopped out early this morning and saved myself a handful of points before going long from 824. I'm now out at 841 and looking to get short again.
Ok short from 841.00 stop at 847 edit: stop at 849

Ok short from 841.00 stop at 847 edit: stop at 849

Monday, April 20, 2009
Goal line defense of the IYG
As destructive as today's action looked in the bank sector today, it's interesting that they held in tight right at a major support area and selling pressure hasn't intensified yet.


looking for a drift higher
covered my shorts at 834 for 22pts and went long again small, looking for a drift higher in the night/early morning session to the 846-850 area and hoping for a chance to flip over short back down to the 820ish area. My view is that we will press higher into the 940ish range if they are able to halt the post opex selling after a few days of testing the lows. I'm not bullish at all but feel the short covering illiquid conidition will conitnue to frighten bears away for a bit longer


short again target 820ies
I'v seen enough for now ... going short target mid 820ies for a short term trade. This is a critical area as there is that ending diagonal pattern to consider here. I'll be watching the chart of XOM to anticipate the bottom of the /ES rising wedge getting broken.


Sunday, April 19, 2009
potential short trigger
It may very well be as simple as waiting for the McClellan oscillator to pierce 100 to go all in short. I'm seriously leaning that way now.


Something worth keeping an eye on
Over on TF there is a discussion going on about the McClellan summation index but the thing that caught my eye was the McClellan oscillator, the way it behaves in counter tread rallies. The pattern seems to be like a coil that builds and ends with one last thrust higher marking the beginning of the next major leg down. If the current situation plays out the same way then the reversal day should come very soon.


Saturday, April 18, 2009
Thought on the bearish put/call ratios
I'm hearing a lot of talk about how bearish the $cpce put/call ratio is recently. I can't help but wonder how much of the drop off in put buying is related to the advent of 3x ETF's
An example would be FAZ, late last year it traded maybe 3million shares a day. Friday's volume ramped over 6000% to 230 million shares traded. Is it possible that that massive volume spike in FAZ BGZ etc is actually bullish short term ?
An example would be FAZ, late last year it traded maybe 3million shares a day. Friday's volume ramped over 6000% to 230 million shares traded. Is it possible that that massive volume spike in FAZ BGZ etc is actually bullish short term ?
another look at fibs, scale and waves
Another look at the chart below reveals interesting relationships developing in the "bottoming action" The beauty of this scenario is that if it were to come true most bulls would be fully loaded while most shorts would be wiped out. The next leg down from the area of 200 day moving average should be sharp and nasty and not pause until what looks like a right shoulder of a major head and shoulders bottom presents itself. I would expect that pattern to fuel more buying and short covering before moving on to deep fresh lows.
All in keeping with the thought that the market wants to cause as much damage as possible in all directions.

All in keeping with the thought that the market wants to cause as much damage as possible in all directions.

Friday, April 17, 2009
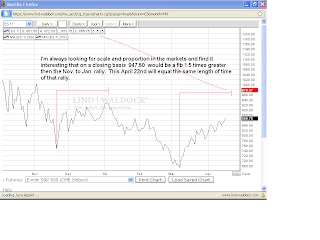
scale, proportion, fibs and symmetry
I'm always looking out for scale, proportion, fibs and symmetry in the chart patterns as they evolve and notice that on April 22nd the /ES will equal the length of time of the Nov.-Jan. rally and fib wise a move of 1.5 times it's length falls at 947.50

Thursday, April 16, 2009
/ES sketching
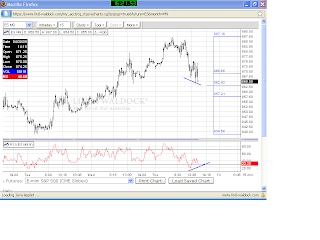
The chart below reveals the potential domino effect of multiple technical signals getting tripped. First the divereged bearish RSI suggest the low (blue dashed line) should get broken by at least one tick. However to get there we must fall out of a rising wedge pattern which is an even bigger bearish signal.

I'm keeping this scenario in the back of my mind as we continue to press higher. I often times sketch "what if" situations, stepping back, looking for symmetry and balance, pushing and dragging daily bars around until things look proportional. This is the best fit I can find assuming a worse case scenario where a massive short squeeze in an illiquid market rockets us up into the 200 mva in just a few days.. it's what kept me from going short today. The intra day RSI flashed a sell signal but on a daily basis, both 9 and 14 day RSI simply looks over bought with no signs of weakening. On the weekly basis the bullish diverged RSI still suggest 943ish should get bested.


I'm keeping this scenario in the back of my mind as we continue to press higher. I often times sketch "what if" situations, stepping back, looking for symmetry and balance, pushing and dragging daily bars around until things look proportional. This is the best fit I can find assuming a worse case scenario where a massive short squeeze in an illiquid market rockets us up into the 200 mva in just a few days.. it's what kept me from going short today. The intra day RSI flashed a sell signal but on a daily basis, both 9 and 14 day RSI simply looks over bought with no signs of weakening. On the weekly basis the bullish diverged RSI still suggest 943ish should get bested.

Bearish divergence in the /ES rsi
I'm about to flip over and go short with the development of a bearish divereged RSI reading on the /ES
EDIT: I covered my longs but was not able to pull the trigger and go short today.. I suspect that we may get an intra-day opportunity to get short tomorrow.

EDIT: I covered my longs but was not able to pull the trigger and go short today.. I suspect that we may get an intra-day opportunity to get short tomorrow.

Wednesday, April 15, 2009
some interesting charts
I'm seeing bullish chart patterns in a lot of sectors. IYG looks to have formed a run away gap which implies an explosive move higher is on deck. Also the transports are pressed up tight against resistance on the verge of a break out. Base metals, ags. (MOO) etc. showing some sweet looking charts every where. /ES never got down to my 823ish and I covered and flipped long small when a bullish divereged RSI signal flashed on the 60min. bars. I'm holding long into the Globex session and hopefully wont get stopped out.


Tuesday, April 14, 2009
some nice symmetry patterns playing out
I'm still looking for that 823ish target on the /ES which could possibly get tagged by 9:30ish tomorrow morning. I'll be hoping to be able to flip long depending on how things look at that time.


Monday, April 13, 2009
short term short down to 823ish
I'm short small the /ES down to 823ish minimum while thinking prices will go higher intermediate term.


Sunday, April 12, 2009
Saturday, April 11, 2009
AA telling us something ?
I believe the action in AA is suggesting the market is doing the reverse of "buy the rumor sell the news" (short covering) There are a lot of shorts trapped and building pressure to blow out positions as we move higher.


Friday, April 10, 2009
Market objective coming quickly

The IYG chart came down on washout volume and hit the lows with a glaring bullish diverged RSI reading. The bounce up came on ever increasing volume and reached it's RSI signal objective. Now a head and shoulders bottom pattern has emerged with confirming heavy volume on the break of the neck line. Momentum continues to press higher and the combo of covering shorts, government manipulation, cooked bank earnings and dumb money coming off the sidelines will see this pattern reach it's objective at 51ish which falls at the 200 day mva area. That is the point where I will get short again.
Wednesday, April 8, 2009
Looking for an area to get short term long
I'm hoping that we see 790ish where I'll get long for another test of that longer term trendline that comes across the weekly chart.


Saturday, April 4, 2009
Corrected weekly RSI signal on SPX
Back in November I jumped the gun and expected a snap back rally back to the RSI objective area based on the signal that was flashing at that time. I wasn't paying attention enough to the cyclical wave patterns in the market at the time and there for didn't give the situation enough time to evolve. Looking back at things I'm now going to trade based on the idea that the true signal didn't complete until late February, which now calls for a minimum objective of 950ish. That also will be an area where the 200mva will come down and offer substantial resistance to this counter trend rally.
I'll be looking for a spot to get long the market in a small way.


I'll be looking for a spot to get long the market in a small way.


Wednesday, April 1, 2009
Head and shoulders building
I remain ever hopeful that we are building a classic head and shoulders top on the /ES and expect to see price roll over and rest right on neck line support right into the unemployment numbers, which I hope will blow a hole through the neck line and send us on our way at least to the .618 fib area around 720ish.


Subscribe to:
Posts (Atom)
