
Saturday, January 30, 2010
$SPX target
I'm looking for a touch at minimum of 1020ish on the SPX to both complete the RSI/200 day moving avg. signal..

Friday, January 29, 2010
$SPX look and feel...
the $SPX has an Elliott style run away a-b-c corrective feel to it which correlates with my thoughts that we are just entering the wash out price phase of the move as signaled by the weekly RSI. I'll not be surprised if Monday is a disaster for what ever reason...


Tuesday, January 26, 2010
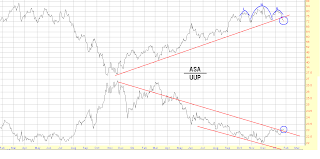
ASA vs. UUP
Looking at ASA (proxy for an international precious metals type of index) against UUP, I'm seeing a topping head and shoulders pattern while at the same time it's breaking below a fairly dependable long term rising trend line. I think ASA is telegraphing expectations for a period of dollar strength...

Friday, January 22, 2010
My plan is to let XOM tell me where the bottom lies
What with RSI weekly basis on $SPX yet to build to the crescendo stage and XOM losing it's grip hold of a very important long term trendline, I'll not think about covering anything until XOM reaches it's first measured move objective which lies down around 55ish and hopefully 47ish. The 55 zone on XOM suggests another 16+% decline or 950ish SPX while 47 zone suggests almost 30% from this week's close, if the $SPX can roughly correlate the action in XOM then the lower target comes in at the 800 level...


Tuesday, January 19, 2010
Long term transports and CSX
Looks like CSX and the rails will be the catalyst for the expected sharp slide down out of the DJTRAN terminal wedge....


Friday, January 15, 2010
What XOM is telling me...
I believe as XOM goes so goes the market and XOM is telling me things are about to get nasty both short and long term....


Friday, January 8, 2010


Wednesday, January 6, 2010
calm before the storm?
Back in Aug 08 the dollar launched higher while $SPX went into an upward skewed holding pattern waiting to see if the dollar would come back. It didn't, and soon there after the $SPX dumped. Looking at the overlay of the dollar and SPX it appears the same potential situation is at hand with the first thrust up in the dollar being doubted by investors. Bad news overseas could ignite phase 2 of the dollar rally and another dump in stocks.
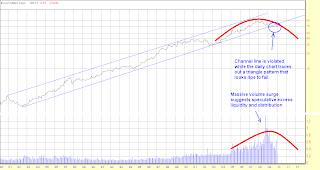
The 1st Chart highlights the current market with Aug. 08.
I removed all the chaos from the one chart to show how we've come full circle and I believe are about to embark on the next leg down....


The 1st Chart highlights the current market with Aug. 08.
I removed all the chaos from the one chart to show how we've come full circle and I believe are about to embark on the next leg down....


I'm seeing RSI divergences on the short medium and long term
I'm seeing a double negative divergent RSI on the intraday charts which stacks up nicely with the weekly sell which is still in effect. This is telling me Friday is going to be ugly...


Subscribe to:
Posts (Atom)
