
Monday, March 8, 2010
Tuesday, March 2, 2010
I'm going with the brief dollar weakness train of thought..
Last night and today's trading in the /ES has me throwing in the towel and looking for a move up to near 1200. With all the talk about massive euro shorts along with the daily rsi on the /DX chart diverging and signaling a dip in the dollar just ahead not to mention the metals and energies took off running today in anticipation, I'm long small /ES looking for nominal new highs on a blow off type move..


Friday, February 26, 2010
If the dollar flushes...
If the dollar flushes then I would expect the stock market might make a run for the recent highs. The RSI divergence on the daily /DX suggests there is a good chance of that happening. However with the weekly sell signal on the /ES still not completed I'm maintaining my net short positions over the weekend...


Tuesday, February 23, 2010

Monday, February 22, 2010
The Bear flag may appear to be fading..
but looking a little deeper at some of the leaders suggests something different might be occurring...


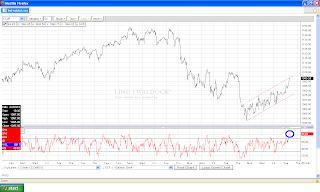
RSI signal on the 120 min. bars...
My hope is that the 120 min. RSI sell signal is now taking hold which is supported by the much larger weekly divergent sell signal which is still calling for a meeting with the 200 day moving average. Also of note is that a channel can still be drawn outlining the over done flag..


Sunday, February 21, 2010
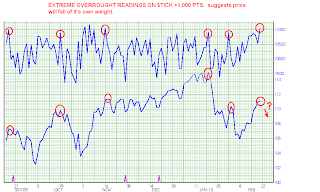
Both daily and intra-day $tick readings at extreme extremes..
A quick glance back over several months using closing $tick values vs. SPY, and even on an intra-day basis, suggests we are at extreme overbought levels with a high probability of a market change of direction....


Friday, February 19, 2010
still not convinced..
I struggled with the idea of covering all afternoon but didn't because I can still see price inside a defined channel with a RSI divergent, though fading, on the 60 minute chart. The 120 minute chart is still a firm sell signal. Also often is the case that price hesitates for 1 or 2 days before reacting to events, this often confuses and gives a false sense of calm specially near C wave terminus...


Thursday, February 18, 2010
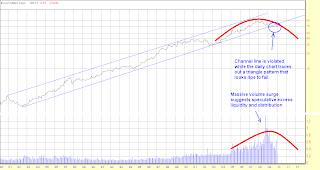
ES/ rsi divergence at the top of the channel
If this is a corrective rally we are right at the limit of where the move should go via both the channel boundaries and the sell signal now flashing on both the 60 minute and 120 minute RSI...
(EDIT: the blogger wouldn't let me upload pics but the post was there prior to the discount rate hike)

(EDIT: the blogger wouldn't let me upload pics but the post was there prior to the discount rate hike)

Wednesday, February 17, 2010
Silver hitting a cieling..
Looks like they raising the hammer for one last severe slap down in silver...


Tuesday, February 16, 2010
smelled like C wave panic covering today...
Got very extreme readings on intraday $tick and RSI and I'd like to think today's close is the high of the move...


Saturday, February 13, 2010
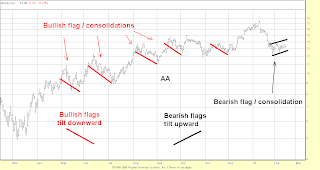
flags and consolidations....
For the most part flags, pendants and consolidations tend to tilt opposite of the primary trend. With Pavlov's dog like behavior folks are pouring into what they believe is a correction in a bull market, confirmed by what has been the case since the March bottom. However I'm seeing chart after chart of bearish flag setups suggesting to me that we about to dump hard...

Friday, February 12, 2010


Thursday, February 11, 2010
More on the Silver Cross...
There are two other points that a trend line can be drawn from that suggest we may need to get as low as 13ish on Silver...


Wednesday, February 10, 2010
Silver Cross
Based on the pattern that has played out throughout the entire bull move in Silver I am expecting support to come in at a minimum of 14ish where I will add to purchases of physical as a hedge against deflation being prevented.


sketching in the action..
RSI on the daily ES plunged pretty deep on the first leg down and now I can visualize the ES drifting up into the 1075ish area the next few days before rolling over and making a stab down at the 200 day moving average. If so, it looks to me like daily RSI may flash a bullish divergence at that point, and so I'll be looking for one of those days where we trade down and trace out a bowl type affair, closing up near the highs at the end of the day. The weekly RSI signal at that point has reached it's minimum objective and with a bullish daily divergence I may have to flip long but we'll see how things look while thrashing around down there at the 200 day moving average...


Tuesday, February 9, 2010
potential 3 of 3 action developing on the ES
It would fit nicely with the idea that we are going down to thrash around the 200 day moving average at a minimum soon with the ES looking like a potential 3 of 3 on deck...


Saturday, January 30, 2010
$SPX target
I'm looking for a touch at minimum of 1020ish on the SPX to both complete the RSI/200 day moving avg. signal..


Friday, January 29, 2010
$SPX look and feel...
the $SPX has an Elliott style run away a-b-c corrective feel to it which correlates with my thoughts that we are just entering the wash out price phase of the move as signaled by the weekly RSI. I'll not be surprised if Monday is a disaster for what ever reason...


Tuesday, January 26, 2010
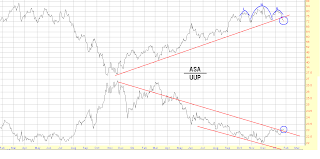
ASA vs. UUP
Looking at ASA (proxy for an international precious metals type of index) against UUP, I'm seeing a topping head and shoulders pattern while at the same time it's breaking below a fairly dependable long term rising trend line. I think ASA is telegraphing expectations for a period of dollar strength...

Friday, January 22, 2010
My plan is to let XOM tell me where the bottom lies
What with RSI weekly basis on $SPX yet to build to the crescendo stage and XOM losing it's grip hold of a very important long term trendline, I'll not think about covering anything until XOM reaches it's first measured move objective which lies down around 55ish and hopefully 47ish. The 55 zone on XOM suggests another 16+% decline or 950ish SPX while 47 zone suggests almost 30% from this week's close, if the $SPX can roughly correlate the action in XOM then the lower target comes in at the 800 level...


Tuesday, January 19, 2010
Long term transports and CSX
Looks like CSX and the rails will be the catalyst for the expected sharp slide down out of the DJTRAN terminal wedge....


Friday, January 15, 2010
What XOM is telling me...
I believe as XOM goes so goes the market and XOM is telling me things are about to get nasty both short and long term....


Friday, January 8, 2010


Wednesday, January 6, 2010
calm before the storm?
Back in Aug 08 the dollar launched higher while $SPX went into an upward skewed holding pattern waiting to see if the dollar would come back. It didn't, and soon there after the $SPX dumped. Looking at the overlay of the dollar and SPX it appears the same potential situation is at hand with the first thrust up in the dollar being doubted by investors. Bad news overseas could ignite phase 2 of the dollar rally and another dump in stocks.
The 1st Chart highlights the current market with Aug. 08.
I removed all the chaos from the one chart to show how we've come full circle and I believe are about to embark on the next leg down....


The 1st Chart highlights the current market with Aug. 08.
I removed all the chaos from the one chart to show how we've come full circle and I believe are about to embark on the next leg down....


I'm seeing RSI divergences on the short medium and long term
I'm seeing a double negative divergent RSI on the intraday charts which stacks up nicely with the weekly sell which is still in effect. This is telling me Friday is going to be ugly...


Subscribe to:
Posts (Atom)
