
Thursday, December 31, 2009
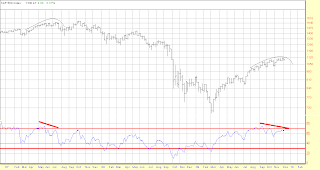
SPX weekly with RSI
wow what a way to end the weekly close.. that last minute mini dive bomber action strengthened the sell signal on the weekly charts and now the 200 day moving avg (40wma on the weekly) is now in the cross hairs...

Wednesday, December 30, 2009
IYR head and shoulders objective hit..
Interesting that just as the IYR is reaching it's head and shoulders price objective we are starting to see bonds roll over. I'm long the April 85 SPG puts from 8.30
The weekly SPX with RSI chart picture is still flashing a sell signal but I'd really like to see a lower close on the weekly bar..

The weekly SPX with RSI chart picture is still flashing a sell signal but I'd really like to see a lower close on the weekly bar..

Wednesday, December 23, 2009
Weekly $SPX
If we can get $SPX to come back to around 1105-1110ish that would take some of the edge off of RSI's rise and still allow for a strong bearish read of the charts. In the chart below I copied and pulled up the RSI and tweaked it to reflect how it would look if we can get a lower close tomorrow to finish off the weekly bar...


Saturday, December 19, 2009

Friday, December 18, 2009
Sell signal intensifies
Today's close coming in below the previous weekly close influences the RSI plot in a way that intensifies the sell signal with a minimum target back to the 200 day moving average. ..


Tuesday, December 15, 2009
DUG vs. $USDUPX.X (U.S. Dollar index)
The normal correlation between DUG and the dollar is on hold while DUG consolidates in a bullish flag pattern. I'm expecting DUG to break higher...


Friday, December 11, 2009
Weekly divergence still intact..
The chart looks like it's stalling out and trying to hold the 1100 area. the outside intraday ranges seem to be tracing out an arc type affair that appears to have reached exhaustion....

Friday, December 4, 2009
SPX vs RSI overlaid with RSI
Once again SPX is flashing an RSI sell signal while UUP is flashing an RSI buy signal. A good visual on the reverse correlation between the two charts is presented below...


expanding triangle for a finish
I think I'm seeing an expanding triangle and hoping she breaks lower...

Also looks like the weekly RSI sell signal is still intact if we can close near the lows of the day...


Also looks like the weekly RSI sell signal is still intact if we can close near the lows of the day...

Tuesday, December 1, 2009
XOM sell signal
XOM has the potential to lead the markets onwards and upwards except there is one little problem.. I've seen this patterned played out before not too long ago....


Subscribe to:
Comments (Atom)
