
Tuesday, March 31, 2009
entering short again small /ES limit 809.00
with a tight stop entering short again via a limit at that 809 level with a tight stop and see if we can stall things out at symmetry zone.

Monday, March 30, 2009
covered my /ES short and BGZ long.
I covered my /ES short and BGZ longs today as we approached that measured target off the broken lower channel line. OBV on SPY did not impress me and RSI is situated to allow for a choppy move higher. Not sure that I want to get long though and may stick to my original plan to get short again heading into the unemployment numbers.


Friday, March 27, 2009
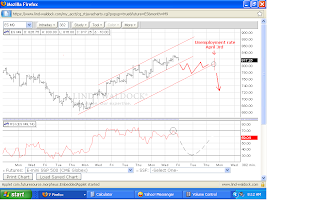
I can imagine a scenerio where the passing of G-20 hot air and the April 3rd Unemployment report will provide a nice environment for a impulsive type wave downwards as these bulls will get their 1st chance to look down from their lofty climb.
In the chart below I double the width of the rising channel which tends to be a nice symmetrical target once existing channel lines are broken. Also RSI is rolling over and should provide the push to get us there. I'll be looking to cover at that point and re-short just ahead of the Unemployment data.
In the chart below I double the width of the rising channel which tends to be a nice symmetrical target once existing channel lines are broken. Also RSI is rolling over and should provide the push to get us there. I'll be looking to cover at that point and re-short just ahead of the Unemployment data.

Wednesday, March 25, 2009
Market looks to be rolling off of resistance
I've taken some heat and covered half my BGZ while still long the XOM puts. Market appears to be rolling off of resistance at 820 to 830 also noticing weakness in the SPY advance via OBV. I'm expecting 760ish to be tested by friday.


I've taken some heat and covered half my BGZ while still long the XOM puts. Market appears to be rolling off of resistance at 820 to 830 and I'm expecting the 1st target of 760ish to be hit.


I've taken some heat and covered half my BGZ while still long the XOM puts. Market appears to be rolling off of resistance at 820 to 830 and I'm expecting the 1st target of 760ish to be hit.
Sunday, March 22, 2009
slowing it down and stepping back for a minute


Looking over some longer term charts, slowing things down and stepping back for a minute, reveals the importance of this March, monthly and end of quarter basis.
The first chart above shows XOM on a quarterly basis for the first time in 30 some years breaking below a well defined upward sloping channel with confirming volume. XOM has to close above 71ish at the end of these next 7 trading days to regain it's composure back inside the channel.
The second chart above shows SPY on a monthly basis breaking below the double top sell signal. Notice the massive rise in selling volume all the way down. Technically speaking, if this is a double top then as we roll back over and down through the lows volume will surge like never seen before. This is based on the basic rule of double tops, which is that the signal only gets trigger on the break of the neck line with along with a surge in volume. SPY needs to close above 76.94 in order to hold above the double top trigger point.
Saturday, March 21, 2009

I continue to maintain my long in BGZ and re opened a position in XOM via 10 July 75 puts @ 9.25 and was happy to see the stock sell off and close near the session lows.
I've attached a chart of /ES which highlights the symmetrical triangle that is back on the table upon seeing price get stopped and roll over right at the apex point, which tends more often then not to signal a intermediate term trend chain.
Thursday, March 19, 2009
Couple of things that keep me Bearish


I was stopped out of my SDS, XOM and SLW yesturday but ended up going long 1k of BGZ, some of the things I'm seeing in the charts...
Tuesday, March 17, 2009
Market at absolute extreme limits


Today the market rallied and closed tightly pressed against the upper limits of the down sloping upper channel line. There is a glaring divergence in the RSI along with, for the 1st time, extreme tick readings which have marked tops pretty consistantly.
I remain fast in my current positions, taking heat but hanging in there.
Sunday, March 15, 2009
Long term /ES channel lines


I'm remaining short XOM and long SDS, looking for the upper long term channel line to contain for now, this current rally. Depending on how the pull back goes I will either cover or add to my shorts.
EDIT: With all the divergences that appeared on the break above 768, I held my positions and continue to be long SDS and short XOM
Tuesday, March 3, 2009
IBM and XOM suggest continued erosion of markets


went long the XOM july 75 puts on the break of 25 year trend line on massive volume, also direct shorted 500 IBM on a obv sell signal.
Subscribe to:
Posts (Atom)
