Monday, August 31, 2009

Broading top continues...

I'm encouraged that no one seems to be seeing the broadening top / distribution action going on as we curl over with a massively diverged RSI signal. I think most discount it based on the fact that we spent several days making nominal new highs which distorted the patterned some what.
I'm looking for weakness down into the 200 moving average zone in the sept/oct time frame....


Crude looked encouraging today with the weekly chart starting to reveal the exhausted upside momentum with decent downside targets...

Sunday, August 30, 2009

79 parabolic gold vs. 09 monthly futs closing basis

In line with my views that deflation will rule the day I took notice of the similarities between the 79 parabolic in gold and the current gold topping action on a monthly closing price basis. I noticed 79 ended with a double top which first broke down towards the .382 fib level and then ultimately reached the .618 level before finding support. That would target the 530ish area of the current chart if things play out in a similar manor.

Friday, August 28, 2009

Current Bear vs. the 1938 overlaid...

Overlaying the 1938 period with the current market action I discovered the remarkably similar price behavior which lines up almost perfectly month vs. month as well. If this fractal should continue to mirror the 1938 time frame then we can expect a quick sharp decline in Sept/Oct a near tag of the 200 day moving average down around 910ish...

Wednesday, August 26, 2009

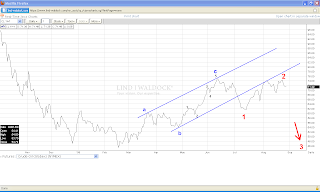
Is Crude sending signals ?

One potential marker of the down leg that I'm expecting in stocks is the price action in the crude futs market. It appears that the corrective move higher occurred within a well defined channel which was broken to the downside followed by a retest back up to lower channel and is now fading and rolling back over. I believe I can count a clear Elliott wave pattern which would suggest a violent move much lower. In the second chart I overlaid the active crude chart with /ES to help me visualize the similar price action between the two.
It appears that Crude did not confirm this move higher in stocks and in fact is about to lead the way lower pulling the stock market down with it......


holding on another day...

The megaphone pattern or lack there of remains unresolved and so I'm holding my positions while seeing some indications of continued distribution with each run up at the highs...

Tuesday, August 25, 2009

still short...

saw no reason to cover today.. still trading inside the expanding megaphone on what looked like more distribution to me. IYG still flashing sell signal...

Monday, August 24, 2009

IYG technical sell signal...

I observed the 1st solid technical sell signal in IYG today based on the diverged RSI. I consider this the most solid sell signal in the chart since the March lows. I went long a half position in FAZ based on this event. I noticed distribution type behavior in other key stocks and given the lower close, as slight as it was, I maintain my short positions...

I continue to read the chart as a terminal megaphone, Elliott 5th of primary 4 with a target of lows below the March lows...

Saturday, August 22, 2009

Deer in the headlights...

I can only assume that the terminal megaphone pattern had one last leg to complete before marking the top. I'll have to cover Monday if it dosn't look like we will close below Friday's close. The chart below shows just how important to me a lower close is...


The next chart courtesy of Mike Burk highlights how the August thrust higher was never confirmed by the 10% trend of new highs...

Thursday, August 20, 2009

not a chance...

While ms market has taken me to the limits of my resolve I remain positioned short with the way the weekly and daily /es is tracing out...


Tuesday, August 18, 2009

BAC about to trigger something ?

Looks to me like BAC could be about to crater based on a terminal rising wedge it is tracing out with confirming fading volume, negative diverged RSI sell signal and interest all dried up on that last breakout higher. Also with IYG looking like it has finished clearing out all the buy stops going back to May I'm thinking it will not take much effort to slice down deep in some of these bank stocks in the coming days...

Monday, August 17, 2009

another handy tool...

I like the Summation Index because it dosn't zig and zag too much and gives pretty good signals that the trend has changed at least in the intermediate time frame. I scribbled on the chart below trying to focus on those points where the Summation index made a turn and how the market price levels correlated to it. I read this as a confirming signal that it is time for the market to come back home to it's 200 day moving average...


another view...

I like the down side leadership....

With Real estate, basic materials and Banks leading the way down suggests to me there is enough cresting momo to reach the SPY 200 moving average at a minimum...


I'm looking for a 1st target of 875ish on the /ES which is where the 200 day moving average is waiting...

Friday, August 14, 2009

Remaining short into the weekend...

Same chart as yesterday updated with the confluence of technical signals that keep me firmly short into Monday...


The Summation index has now clearly turned down and is confirming at least a correction consolidation of an intermediate price/time frame...

Thursday, August 13, 2009

Still can't cover...

I'm observing a potential expanding triangle top which should be limited by the 1018 resistance area on a closing basis. The 1018 area is the .382 key fib level from the Oct. 07 market top. This also lines up with a bearish divergent RSI sell signal, a stalling out of the summation index and all of this occurs at a point where the price spread against the 200 day moving average is about as wide as it has ever gotten absent the crash wides..

Wednesday, August 12, 2009

Summation index...

One indicator I like is the Summation Index because when it stalls out and turns it usually marks a decent intermediate term trend change. Do I detect stalling action ?

EDIT: ok that's pretty blurry but I'm trying to show the recent plateauing action the last 3 days


GS OBV

I'm seeing this bounce in GS as a flag and looking internally via OBV it's obvious that the OBV line was pushed down during the selling on healthy volume but the subsequent bounce is coming on much lighter volume as reflected in the OBV's inability to make a higher high with price. I see this as market makers forcing buyers and shorts to chase the offer and I'm expecting a pull back in price on increased volume by tomorrow afternoon..


I'll be looking for price action along these lines by the end of this week...

Tuesday, August 11, 2009

COF

Looks like a good time to be short COF...

If the S&P was an attack dog...

and the 200 day moving average was his leash then that mean old dog is about to get yanked back hard and soon..


Continuing along that line of thought I'm wondering if there are any technical indicators out there that automatically adjust the potential distance price might pull away from it's base line 200 day moving average (or some other optimized avg) based on some reading of volatility such as the $VIX with buy/sell signals triggered when price reaches said limits...

Sunday, August 9, 2009

GS technicaly

Hopeful signs that GS may have stalled and is about to at least "back and fill" according to the basic technicals on both daily and weekly charts...


Friday, August 7, 2009

Holding over the weekend..

With the dollar strong all day I decided I didn't have to worry about SMN or DUG getting away from me and with GS getting pounded all day on better volume I decided to hold onto my positions into the weekend. We kissed the .382 fib of the entire move from the top on the S&P while at the same time completing the RSI buy signal target on the weekly which I regret not trusting this time around. I may cover if today's intra-day highs get taken out on a closing basis next week.

Thursday, August 6, 2009

Target /ES 950ish

It appears to me that the 1st resistance on /ES should come in at around 950ish which would be the expected target now that price has falling out of the terminal rising wedge as per traditional TA text books which state price should come back to where the wedge first began. Also at that level the .382 fib zone comes in which stacks nicely with the previous resistance(top of failed head and shoulders).

Wednesday, August 5, 2009

Top is in...

ok the top is in.. almost had to cover as we retouched the lower wedge line from below but the action turned lower as hoped.
also is that suppose to be a breakout in GS ? no volume into a diverged RSI ? don't think so and looking for a first target under the blue dashed line...


Tuesday, August 4, 2009

Wedge complete..

I've looking for a terminal rising wedge top completed for a finale high which comes with a negative diverged RSI reading on the 120 min. bars...

Saturday, August 1, 2009

As I see things..

I'm noticing a nice tight little rising wedge in /ES while at the same time the dollar is tracing out a falling wedge with a bullish diverged RSI reading. I'm expecting a strong dollar rally and a stock market decline as these things break together.