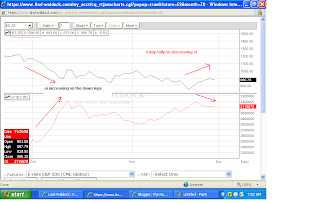

The first chart shows how on the down legs open interest expands and on the up legs open interest contracts. It suggests to me that sellers still run the show and have only temperarily taken a break before the next down leg begins again.
The second chart reveals some of the short term cycles going on in the /ES.
Timing wise it would suggest that another peak is being made.
charts to follow:

No comments:
Post a Comment