Saturday, November 29, 2008
Long term $TNX vs. $INDU
Going back over the last 40 years on the $TNX it's obvious that we are stair stepping down hitting round numbers on rates as we go, 10% - 7% - 5,4,3 etc all the way down within a clearly defined channel and have now reached a point where price has broken through the 3% level on it's way to 2% and possible even 1% unbelieveable as it might seem. A 2% ten year return is predicting simply that the economy will remain in a quagmire for many years, drowning in goverment debt. I envision a scenerio where folks begin to dip their toe back into the stock market enough that it draws money out of the bond market, bonds then sell off sending stocks even lower which triggers another flight to quality oscillating back and fourth over a several years. I suspect using bonds as a signal to trade stocks along with momentum oscillators will give the best triggers for putting on and off stock trades. At some point when the $TNX bottoms and starts to turn up stocks will then be a tradeable long play on a multi month basis but not yet. I plan to play short side only until that time.
Friday, November 28, 2008
Ending diagonal on the 10 year ?
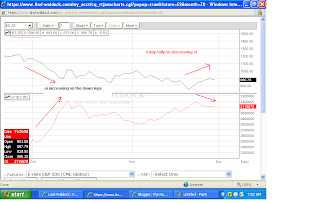
/ES open interest and short term cycles
The first chart shows how on the down legs open interest expands and on the up legs open interest contracts. It suggests to me that sellers still run the show and have only temperarily taken a break before the next down leg begins again.
The second chart reveals some of the short term cycles going on in the /ES.
Timing wise it would suggest that another peak is being made.
charts to follow:
Wednesday, November 26, 2008
Thanksgiving eve rally
I tried to get short the S&P via SDS but got stopped out for a loss.
I went short again in the evening session from 90.05 and I'm looking for a retest of the lows. Today looked like low volume short covering as open interest has been decreasing throughout this 4 day up move. It looked to me like resistance came in right at the Bollenger band mid range, which is the same area where a trend line drawn down from the Sept. highs intersect. I expect selling pressure to resume into next week.
chart to follow:
Saturday, November 22, 2008
India ETF might lead
It's saturday going into a my weekly Thanksgiving vacation period and I'm completely flat and out of the market. I'm currently digging around looking for a sector that will out preform in a Bear market rally into the Feb/Mar time period. In Friday's bounce, the Gold / Energy / Utilities ultra Etf's seemed to lead % wise but something tells me those won't be the sectors that will sustain in a 4 to 8 week bounce. I like the India fund, ticker PIN with a target above 15 but it's too illiquid for me. Ok I just found it, EPI WisdomTree Trust, it bounce sharply on friday showing relative strength leadership a healthy 14% with just barely enough liquidity to be playable. I'm hoping we correct some of this Opex rally or even hit fresh lows before I make a play on this into the feb/Mar time frame.
Wednesday, November 19, 2008
Open interest is not following price in the Yen futs
Saturday, November 15, 2008
Subscribe to:
Posts (Atom)