Monday, December 29, 2008

Continued profit taking into year end


It appears to me that profit taking continues to influence the markets as is evident in the heat map attached. There is not much profit taking left in the financials after they where ripped apart during the short covering ban, at least not enough to cause prices to drift higher into year end, however those sectors that collapsed, ie. the energy and basic materials sectors are now drifting higher as those folks with substantial profits take them this year, ahead of any potential change in tax policy. The builders and reits however, continue to see selling pressure and in my opinion will not present any near term oppertunities to get short, forcing those that want to catch a ride to chase prices lower.

Tuesday, December 16, 2008

Once again bumping up against extreme resistance


The /ES managed to push up into extreme resistance triggering another signal to sell short based on daily extreme closing ticks as noted in these charts.

Monday, December 15, 2008

SPY head and shoulders on 30 min. bars


It's starting to look to me like a head and shoulders pattern being traced out on the SPY 30 min. bars, with a confirming OBV skewed to the downside reflecting increased selling on the down legs.

Monday, December 8, 2008

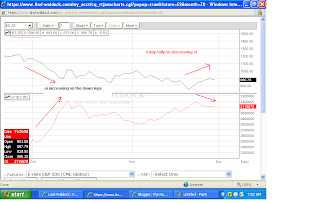
OI on the /ES


notice clearly how open interest expands on selling and fades (closing out poistions) on the rallies. Just another one of those signs that indicates the primary trend is still down.

Sunday, December 7, 2008

closing ticks tripped yet another meaningful signal


Going back over the previous 6 instances where $tick data closed over the 1000 band, it lead to an immediate deep down leg in the markets

Thursday, December 4, 2008

XLU vs. HYG (high yield bonds)


Through out the Bear market that began in late 07 the utility index XLU and the high yield bond index HYG have tracked each other tick for tick. I'm noticing now that HYG and JNK are both on the verge of testing new lows while the utility index is trying to hold it's ground. I believe that the utilities will be part of that group of stocks that the mutual funds puke up in the scenerio that Atilla talks about and this divergence is suggesting we are right on the cliff's edge.

The 2002 CRB bubble bull


After reading a stand out trader named Atilla's comments about the mutual funds and how they are about to puke up their core holdings I thought about the things that might trigger this and I believe the answer lies in the commondities market. Looking at the CRB index you will find that we have just cracked the .618 fib and are about to capitulate down to and probably beyond where the crb bull market began back in 2002.
Remember that the entire market was build on fluff from 2002 right up into the top. Keep your eye on the CRB index.

Wednesday, December 3, 2008

RSI and channel line set ups


Looking at the situation another way you'll notice that 2nd/3rd test of upper channel lines are tested while RSI is in the 55 to 60ish range which is as much snap back as one can expect during any rally in a bear trend. We are currently right in the zone now.

pressed against resistance and ready to roll over


As per the chart above, I read the current action as crushed against resistance and ready to roll over and head lower through the night session and into tomorrow.
on the 120" /ES chart RSI has reached each upside limit range as would be expected in a down trend as it traces out a negatively divereged pattern.

Tuesday, December 2, 2008

Test of the lows on deck


Chart balance and symmetry allows for a situation where we sell off hard and close at the lows followed by a deep gap and crap, hopefully on extreamly heavy volume which could mark the begining of an intermediate bull market. This type of event would look well within the fit and proportion of the current chart picture.

Saturday, November 29, 2008

Long term $TNX vs. $INDU


Going back over the last 40 years on the $TNX it's obvious that we are stair stepping down hitting round numbers on rates as we go, 10% - 7% - 5,4,3 etc all the way down within a clearly defined channel and have now reached a point where price has broken through the 3% level on it's way to 2% and possible even 1% unbelieveable as it might seem. A 2% ten year return is predicting simply that the economy will remain in a quagmire for many years, drowning in goverment debt. I envision a scenerio where folks begin to dip their toe back into the stock market enough that it draws money out of the bond market, bonds then sell off sending stocks even lower which triggers another flight to quality oscillating back and fourth over a several years. I suspect using bonds as a signal to trade stocks along with momentum oscillators will give the best triggers for putting on and off stock trades. At some point when the $TNX bottoms and starts to turn up stocks will then be a tradeable long play on a multi month basis but not yet. I plan to play short side only until that time.

Friday, November 28, 2008

Ending diagonal on the 10 year ?


Looks like a potential ending diagonal on the 10 year note futes. I'll be keeping my eye on that while trying to re-short the /ES from that .618 fib area at 905ish

/ES open interest and short term cycles


The first chart shows how on the down legs open interest expands and on the up legs open interest contracts. It suggests to me that sellers still run the show and have only temperarily taken a break before the next down leg begins again.
The second chart reveals some of the short term cycles going on in the /ES.
Timing wise it would suggest that another peak is being made.

charts to follow:

Wednesday, November 26, 2008

Thanksgiving eve rally


I tried to get short the S&P via SDS but got stopped out for a loss.
I went short again in the evening session from 90.05 and I'm looking for a retest of the lows. Today looked like low volume short covering as open interest has been decreasing throughout this 4 day up move. It looked to me like resistance came in right at the Bollenger band mid range, which is the same area where a trend line drawn down from the Sept. highs intersect. I expect selling pressure to resume into next week.
chart to follow:

Saturday, November 22, 2008

India ETF might lead

It's saturday going into a my weekly Thanksgiving vacation period and I'm completely flat and out of the market. I'm currently digging around looking for a sector that will out preform in a Bear market rally into the Feb/Mar time period. In Friday's bounce, the Gold / Energy / Utilities ultra Etf's seemed to lead % wise but something tells me those won't be the sectors that will sustain in a 4 to 8 week bounce. I like the India fund, ticker PIN with a target above 15 but it's too illiquid for me. Ok I just found it, EPI WisdomTree Trust, it bounce sharply on friday showing relative strength leadership a healthy 14% with just barely enough liquidity to be playable. I'm hoping we correct some of this Opex rally or even hit fresh lows before I make a play on this into the feb/Mar time frame.


Wednesday, November 19, 2008

Open interest is not following price in the Yen futs


One of the reason I am suspicious of this move lower is interest in the Yen up move is waning while price continues to drift higher. Our stock markets tend to follow the Yen and if the Yen should break lower our stock market should move higher.
chart to follow:

Saturday, November 15, 2008

I went long SSO and UYG fairly heavily and I'm expecting a price target of minimum 1020ish on the /ES

The chart below shows the key reversal day on heavy volume accompanied with bullish diverged RSI I like to keep things technically simple and the charts clearly indicate that we should get a bounce.


Monday, October 20, 2008

20 Oct. 08

It's been a long time since I've posted here and in that time my account is up substantially.
I covered those put options in the utilities for apprx. 25k gain.
My account is now upwards of 300% combined between my brokerage account and my futures trading account.
I am currently long gold futures from 798.60 with a target of 830ish. I'm also short 2 /ES contracts and hoping to get the chance to add more if the market starts to break my way.

Sunday, August 3, 2008

2 aug 08

It's been several weeks since my last posting and I've had a major change in my outlook on the economy and now expect a protracted recession and accompanied deflationary pressures.
I'm now short the basic materials sector via SMN holding 1000@ 34.75. Also since I'm unable to short any banks/brokers directly I went long SKF from 122. I observed what looked like a long term topping head and shoulders pattern on the Utility index and decided to front run the pattern from the top of the right shoulder by buying puts on XLU and FPL and so far that decision is working well. I'm currently short 4 /ES (e-minis) and anticipating a break downward out of the current triangle pattern which also happens to be at odds with what most traders are expecting.
Ive posted a few charts on a traders forum that I frequent that show what looks like a very bearish long term double top in XOM which is support by the daily /weekly and monthly chart. I'm going to take a position short tomorrow I think but havn't decided what my plan of attack will be just yet.

Friday, July 11, 2008

11 July 08

It has been many months since my last update and in that time I have traded in and out of many positions. My worst draw down was as a result of the fed stick save in march that rallied the market up to the 1440 area in June. I had my 1st margin call as a result of the stick save rally and deposited another 2k into my account. In fact at the peak of June my margin was so tight that I was only able to trade 1 contract at a time until the market fell back enough and grew my cushion enough to start trading up to 4 /ES contracts at a time. Currently I am short 2 /ES and 1 Gold contract into the weekend. Year to date my account is up 84.3%

My outlook is still bearish stocks and looking for a target of 1170-80ish before a corrective bounce might occur. I'm continuing to stay long Gold and moving my stop up as the market rallys.

Saturday, April 12, 2008

12 April 08

I havn't posted to here in many weeks having been busy with other things but currently my trading account is up 33% since it's inseption. I'm currently short 3 E-mini S&P contracts over the weekend and am looking for further downside, hopefully into new lows in the bearish trend.
My stock trading account is up by over 50% since focusing my capital in the Investment banking and Savings and Loan areas on the short side. My current positions are short 2k of WM another 500 shares short in Leh and lastly 1k short in NYL. I noticed that the banks/brokers held up well on fridays strongly down GE market and am now thinking about covering this positions and looking at other sectors to ride the bearish cycle down with.

Tuesday, February 19, 2008

Feb 19/08

In an effort to maintain my short position I put on and stopped out of 2 trades in the holiday overnight market. However last night I went short again for a 3rd attempt on the short side and woke up this morning in the money for about 10 points of downside movement. I continued my short of 1 @1365 and today's market followed thru on the downside closing at 1352. My plan is to maintain my short with a wide stop with a long term objective of that 800 area on the SPX.

Liquidation value $16,470 (+$1,640)

Sunday, February 17, 2008

Feb 17-08

Globex opened down 5 points, it's 6:30pm and the market is currently meandering, waiting for asian markets for direction. The U.S. markets are closed tomorrow for President's day holiday.

*current position short 1 ESH8 @ 1349.75

Saturday, February 16, 2008

The 1st week of trading

I opened an account with Lind-Waldock and have discovered that they do a pretty damn good job of getting me quick fills, confirms, cancellations and position updates. Their charting program is fantastic and I'm very pleased. I began trading immediately upon their notifying me that my account was set to go.
Opening account balance = 15,000
my first 4 trades were all bad and I quickly drew down to 13,700 at which point I gathered my thoughts, cleared my head and the managed to trade well on the next 4 trades or so raising the balance to 16,700.
Friday at the close I covered my profitable long and went short 1 @ 1349.75 ( insurance against some unforeseen bad event over the long weekend) I will determine a buy stop point sunday night when the globex starts trading again.

I'm currently tilted to the bearish side though I can flip on a dime trust me... over the long term I see a giant double top completing that began in 2000 on very heavy distribution volume, and now in 08 we are sliding down the other side with my 1st long term target @800

I'm hopefull that I can maintain my current short with a wide stop but also recognize that we are currently in a short term triangle that can resolve itself violently up or down so I'm going to just wait until sunday night to conclude my expectations.