
Sunday, May 31, 2009
Summation update..
The summation index has been a good indicator of trend change in both directions lately though I've highlighted the Bearish case which obviously is my bias...


Saturday, May 30, 2009
What I think I see going on...
Friday had the feel of a blow off top which came about near the end of the day when the SPY creeped higher and touched the 200 day mva for the 1st time since the Bear market began. I think this triggered huge black box buy orders in the various stock index futures markets which was evident in the volumes. I also suspect that certain players anticipated this reflex and laid into the spike with massive sell orders, closing longs and even flipping over into new shorts. Monday could feel quite painful intra day with a cup and handle type break out look to it with confirming heavy volume but my money says it's a trap and that break out volume will actually be distribution selling, finishing with a lower close. This will also set up the first diverged RSI sell signal on the daily SPY chart since the March rally began. I still believe the dollar will begin trending higher along with bonds while stocks, pm's, basic materials will begin a trend lower.


Thursday, May 28, 2009
I'm seeing the top in gold and silver
getting a nice divereged RSI reading on an over extended rally in Gold and I believe we are heading for the high seven hundreds....


Tuesday, May 26, 2009
staying short
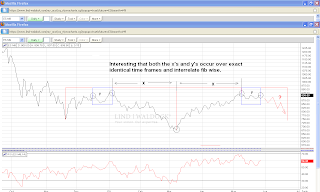
I remain short until the globex highs of May 7th get taken out. Interesting how time frames between highs and lows remain interrelated fib wise as highlighted in the chart below...

Monday, May 25, 2009
What's going on with Gold ?
Two months after QE "printing" and a sharp sell off in the dollar this is the best gold can do ? I think Gold is about to put to rest this whole inflation nonsense within days if not hours....


Dollar bounce on deck
The technical chart picture of UUP suggest we will see a bounce in the Dollar this week and I'm hoping it gets started as soon as Tuesday which also lends support to the Bearish charts in SPY, GLD and SLV...


Friday, May 22, 2009
seeing more head and shoulders set ups
Lookking at the SPY on an intraday basis I'm seeing another head and shoulders pattern with confirming sell sided pressure revealed as we rolled over the right side of the head. This suggests that the trend has turned and will be confirmed as we break the neckline on increased volume as per the chart below...


Thursday, May 21, 2009
IYT transports looking ready to make a move

The IYT trasports index in the chart below appears to be developing a head and shoulders pattern and a glance at the OBV picture confirms the increased sell side pressure as is obvious on the right side of the head. Sometimes this kind of indication can be used to jump the gun ahead of the actual break of the neckline.
Looking for a spot to short the 3x long bond bear etf
the TLT chart looks to be compressing the coil spring with a potential launch higher next week going into that mega billion dollar bond sale. My plan is to short the 3x 30year bond bear etf TMV and hopefully with a nice tail wind from a stock market sell off somewhat as sketched in the chart below...


Wednesday, May 20, 2009
Looking for a test of 900 on the /ES
I'm expecting a retest of 900ish on the /ES and hope that we can blow through it and get a nice deep pull back...


Subscribe to:
Posts (Atom)
