I continue to maintain my long in BGZ and re opened a position in XOM via 10 July 75 puts @ 9.25 and was happy to see the stock sell off and close near the session lows.
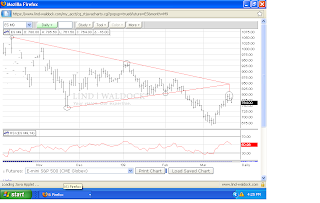
I've attached a chart of /ES which highlights the symmetrical triangle that is back on the table upon seeing price get stopped and roll over right at the apex point, which tends more often then not to signal a intermediate term trend chain.

No comments:
Post a Comment