Sunday, October 4, 2009
long term cycles in tax rates..
If one could apply ta to a long term chart of tax rates and assume there is a cyclical nature to it then the below chart courtesy of Dshorts.com, (which I have molested with crayon scribbles in order to help expose the correlation with stock prices) suggests that tax rates are about to spike higher to try to pay down the debt binge of the last 20+ years causing the stock market to struggle for the next decade or two...


collapse speed..
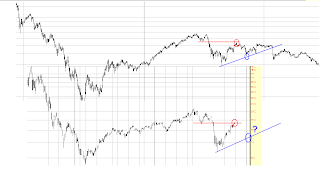
One possibility is that we've collapsed too rapidly beyond a lower downward trend channel and the market needed time to catch up with a more orderly drain of funds out of the stock market.. something similar to the angle of descent during the tech wreck (yellow price channel). If so the next move should be down to an area that either defines a new point along a lower bullish trend channel, or worse, a move to new lows....


Friday, October 2, 2009
intra day flag action...
Thursday, October 1, 2009
This time adding one word....
Adding one word (dow) search field, which is probably what the typical mutual fund/retail trader might use in comments spread out over the internet reveals a massive difference in the numbers....

Ok I should have refined the search by time frame. Looking back one week it reveals twice as many bullish hits..


Ok I should have refined the search by time frame. Looking back one week it reveals twice as many bullish hits..

A look back at an odd market turn...
I keep coming back to that failed head and shoulders break out that occurred at the 87ish area on the SPY and the volume action that occurred or didn't occur at that time and all the way up since then. As the chart below highlights every single market turn has been marked by a volume spike which one would expect to see. Oddly the one instance where no volume markers occurred is at that failed head and shoulders pattern, which one might expect to see the largest spike of all on the entire chart. My first target is 93-94ish on this down leg but I'm wondering if we are in fact riding on a giant air pocket and now need to retest that 87ish zone at a minimum at some point soon.


Tuesday, September 29, 2009
Friday, September 25, 2009
comparing the magnitude of the bounce vs. 03 bounce
Thursday, September 24, 2009
Subscribe to:
Posts (Atom)


