Monday, August 29, 2011

1221ish on the SPY for the top of the flag conitnuation pattern

Lots of people have given up on chart patterns since the fed began rigging the market with pomos but is it possible that we are seeing patterns re-emerge with predictive potential, at least while we are a ll waiting for the next fed QE operations ?
I believe we are at the top of the flag trading range right now and will begin to sell off to fresh low before any base can be formed. I may flip and go long but only after seeing some lower lows for the move off the top....




Saturday, August 13, 2011

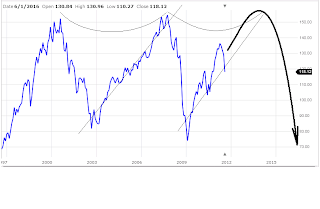
My long term view...

I think based on the idea of zero interests rates for the next 2 years per the Fed, along with endless rounds of money printing will make the dollar the new carry trade. This will inversely prop the stock market higher. Also, stepping back from the shorter term charts my view does lend the chart picture more symmetry. This last push back up to the top should be led by inflation/commodity plays.. I'm considering MCP as a lead horse if it doesn't run away from me....


Thursday, August 11, 2011

Put/Call ratio...

Looking at a chart of the 10 day moving avg. of all puts and calls with an S&P back drop we have reached extreme levels of panic, which I believe will help fuel the next rally. I also think this portents a nasty sell off in gold and silver in a one off kind of way, that and the fact that gold ramped up above platinum, all signals to me the sheep are stampeding over a cliff...


Wednesday, August 10, 2011

SPY vs. GLD

Where as there was a correlation between GLD and SPY moving together lately, in the most recent parabolic stock drop the correlation has flipped inverse, obviously a sign of panic. The panic is legit, however if the EU pulls something out of their ass it means stocks will knife higher and gold will collapse. This tells me that any QE3 announcement will be a sell the news in gold event.


Weekly SPY closing line chart basis....

It's possible that despite all the bearish news that (via a dollar plummet) SPY could close the week at 120ish, which then tucks it's chart action right back up into the lower longer term trend channel.. as though this week never happened in the grand scheme of things.. of course in real terms any new highs would only be in nominal terms....


Time for silver to take another slap down?

Looks like silver wants some more attention...


Friday, August 5, 2011

135ish on the spy is the next target

The bottom is in. We can thrash around down here for another week or two but the break out will be higher up to 135ish on the SPY before it corrects to any degree. My ultimate target is 141...


spread closed on SLV/JJC

..and there you have it. Silver / Copper spread has closed but I do expect much more selling of both, down to 24ish on silver...


Thursday, August 4, 2011

spread begins to close...

I'm wondering if once the spread between SLV/CRBQ/SPY closes it signals covering equity shorts and going long on a QE3 announcement. The spread is beginning to close today...


Wednesday, August 3, 2011

precious metals in a secondary blow off....

another view of the situation in silver is compared to both SPY and CRBQ which are suggesting major market slow down while silver breaks away to the upside. This spread will close soon enough....


copper / silver spread suggest good time to short silver

based on the 10 day comparison chart between copper and silver it looks like a good time to ease into short positions in SLV....


Tuesday, August 2, 2011

Head and shoulders neckline ready to bust

Looking for the neckline to break *briefly* at 1268 (closing basis line chart) taking us down hard leading into QE3. I still expect a new high into November as per the second chart...