If the dollar flushes then I would expect the stock market might make a run for the recent highs. The RSI divergence on the daily /DX suggests there is a good chance of that happening. However with the weekly sell signal on the /ES still not completed I'm maintaining my net short positions over the weekend...
Friday, February 26, 2010
Tuesday, February 23, 2010
Monday, February 22, 2010
The Bear flag may appear to be fading..
RSI signal on the 120 min. bars...
Sunday, February 21, 2010
Both daily and intra-day $tick readings at extreme extremes..
Friday, February 19, 2010
still not convinced..
I struggled with the idea of covering all afternoon but didn't because I can still see price inside a defined channel with a RSI divergent, though fading, on the 60 minute chart. The 120 minute chart is still a firm sell signal. Also often is the case that price hesitates for 1 or 2 days before reacting to events, this often confuses and gives a false sense of calm specially near C wave terminus...
Thursday, February 18, 2010
ES/ rsi divergence at the top of the channel
Wednesday, February 17, 2010
Tuesday, February 16, 2010
smelled like C wave panic covering today...
Saturday, February 13, 2010
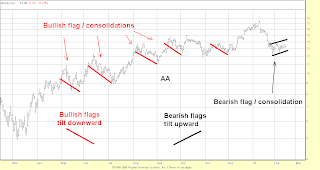
flags and consolidations....
For the most part flags, pendants and consolidations tend to tilt opposite of the primary trend. With Pavlov's dog like behavior folks are pouring into what they believe is a correction in a bull market, confirmed by what has been the case since the March bottom. However I'm seeing chart after chart of bearish flag setups suggesting to me that we about to dump hard...
Friday, February 12, 2010
Thursday, February 11, 2010
More on the Silver Cross...
Wednesday, February 10, 2010
Silver Cross
sketching in the action..
RSI on the daily ES plunged pretty deep on the first leg down and now I can visualize the ES drifting up into the 1075ish area the next few days before rolling over and making a stab down at the 200 day moving average. If so, it looks to me like daily RSI may flash a bullish divergence at that point, and so I'll be looking for one of those days where we trade down and trace out a bowl type affair, closing up near the highs at the end of the day. The weekly RSI signal at that point has reached it's minimum objective and with a bullish daily divergence I may have to flip long but we'll see how things look while thrashing around down there at the 200 day moving average...
Tuesday, February 9, 2010
potential 3 of 3 action developing on the ES
Subscribe to:
Posts (Atom)