Wednesday, July 29, 2009

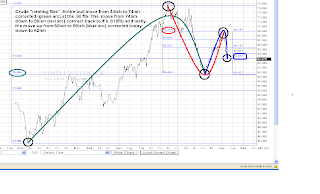
Crude action..

Interesting how crude continues to trade within it's fib frame work on multiple levels. The chart attached highlights the "nesting fibs" action and how it interrelates. The second chart shows the same without some of the sketched confusion...


my visualized target daily basis

As a result of the extreme short covering thrust higher that has traced itself out during July I'm now targeting the 750ish area on the /ES based on a measured move down from where it all began...

Monday, July 27, 2009

RSI OBV signals on the .SPX..

Interesting that both RSI and OBV are flashing a sell signal on an intra day basis with weekly charts supporting the possibility that the top is in....

Crude fibs...

Interesting spot for crude to be repelled right here and now...

$VIX behaviour..

I'm noticing that with each touch of the $VIX along it's arching base line has resulted in a correction of anywhere from 40 to 60 S&P points.. also it appears as though once the base line is touch and the $VIX moves away it dosn't look back *double touch etc.*
I expect this latest bounce away from the baseline to mark the top of this market run....

Sunday, July 26, 2009

playing with the bloomberg charting..

Remembering back in the day when $tnx and the 30 year mortgage rate mirrored each other (blue box) and wondering when and which way this spread distortion will resolve itself. If things are so rosy shouldn't this spread be tightening even just a little bit? I'm thinking 6.5% on a 30 year fix mortgage is very possible.

another observation..

I noticed that we've reached an area parallel to the shoulder line when drawn across from the head and suggests we've reached an area where the market can stall out, roll over and retest some of this bullish resolve out there...

Basic weekly technicals...

Nice timing on all these new calls for 1150ish S&P, Dow theory buy signals, golden crosses , fed manipulation to dow 15,000 etc etc. This is all very reassuring to me and solidifies my Bearish outlook. My read on things is that it's over and now we can come back and start testing all this bullish resolve. We may make a few narrow intra-day highs this week as the bar clusters trace out a sort of rounding top but that's about it...


An artist's eye or complete insanity? Time will tell I guess.. I'm posting this for the record, come what may..

Friday, July 24, 2009

RSI divergences


Taking some pain as we approach 980ish which I thought was possible anyway.. contemplating adding to shorts into the close. I'm seeing some nice divergences building on intra-day, daily and also weekly which suggest we've run far enough and I'm sure chased enough Bears away to slice downward without much effort at all. Crude oil has reached it's .618 fib near it's upper channel line while RSI on the 120min. bars is Bearish diverged. Dollar coiled for a potential snap back higher next week and so I'm staying short and possibly adding into the weekend...


Tuesday, July 21, 2009

Looking for a pump and dump kind of day...

I'm thinking we are close to a dollar ramp, oil/basic materials sell off and have added some DUG to my positions. My thoughts are that the perfect Bear confirmation will be a decent upside open tomorrow morning on the back of AAPl earnings with a heavy volume distribution day and a lower close. The chart below of UUP appears to be pressing lower into a bullish diverged RSI as if loading a coil spring while at the same time we are approaching a short term cyclical low. If we get a sharp snap back dollar rally then I would expect it to occur while the stock market and oil are selling off sharply....

Monday, July 20, 2009

SPY OBV....

I'm noticing on the SPY the same sort of OBV action that occurred just before a nice sharp down turn ( red square area) Once again we have air pocket type action in price with OBV pulling away and heading lower and not only on the shorter term but stepping back a little I'm seeing an even larger divergence ( blue lines )

Crude oil target..

I'm seeing a convergence of technical reasons why I believe 66ish zone will mark the highs in the crude oil market and plan to re-enter shorts in that area as per the chart below...


Saturday, July 18, 2009

All hands effort to prop the markets..

I had been eying closely the fractal like similarities between the multi year post tech wreck rally and the price action off the recent crash lows. Everything seemed to mirror fairly closely until this last week where it appeared there was an all out effort by many to prop the market at a key point in the fractal structure (at the edge of the collapse).
I've rough sketched what I was seeing in the chart below. At this point I'm holding my shorts and will be watching if the dome highs get taken out on a weekly closing basis. Regardless if the dome highs get taken out we are still very close to the top of this market and I'll have to decide if I should cover and re-short up around 980ish or sit and take the heat in the event the next leg down is triggered over seas in which case there will be many regrets for having covered a few days too soon.. it's just the nature of the game. The second chart reveals the RSI setup on a weekly basis that is now unfolding and why I remain Bearish even if the dome highs resistance fails...


Thursday, July 16, 2009

Not covering..

It took them a while to blow through that 929ish area but finally after a probable intentional mis-quote they managed to break up through it though I don't expect it to last long as now I'm seeing a juicy looking RSI sell signal....

Wednesday, July 15, 2009

Elliott wave count...

I'm always keeping my eye out for Elliott type wave relationships as often times they help mark shorter term turning points. There is always much debate about the correct primary wave count but sometimes wave segments seem to come in focus out of the blue and when I see them I latch on to them. In the chart below I highlight the battle that occurred up at the June highs, looking back on it that was one hell of a battle that was waged and I now believe it marked the ending of the bounce off the March lows. If this is in fact true then a wave count can be fitted which clearly defines wave 1 as labeled in the chart below. Wave 2 if labeled as a running flat shows very interesting wave price relationships between waves a, b and c, all of which ends with a brutal rally up to 929ish, characteristic of c waves is the steepness and the extreme levels reached on the RSI, (highest level since the March bounce began) Finally running flats tend to suggest that the next leg, (wave 3) should be massive and violent.

Another thing that might help exasperate the next leg down in stocks is if the crude oil market decides to head down into those low 50ies. The chart below argues that the turning point in crude might be close at hand...

Tuesday, July 14, 2009

I'm undecided for the moment....

I've covered everything except the GS puts which I may have to dump tomorrow with the way the intra day on-balance volume is looking on it. The S&P launched higher at such a steep rate out of what now appears to be a failed head and shoulders pattern that I suspect it will take several days to roll over if at all (perhaps something like the blue circled area on the chart) With out any clear signal via RSI I'm going to have to sit this thing out. If S&P does roll over then I will re-short on a penetration of the 884ish area (red circled area on the chart) other wise I believe there is a good chance we re-test the 950 area.

Monday, July 13, 2009

EXTREME TICKS

I see this as a last ditch effort to shake out some Bears via a retouch of the head and shoulders neck line from below. This also clusters nicely with the 50% fib from the top of that right shoulder while pulling the RSI up into over bought range.


I noticed that we've reloaded the $tick gun which should help us get a nice down side start to the day tomorrow..

Friday, July 10, 2009

crude weekly..

Interesting that the 50% fib level seems to be holding on a weekly basis. I'd like to see us penetrate that at some point to help the deflationist cause. Also if the top was in fact a distorted head and shoulders then the 1st target down has been hit.. I may hedge my SRS and EEV positions by going long DIG into the weekend...


Thursday, July 9, 2009

SRS

Sometimes you can strip away all the technical indicators from a stock chart and just the plain and simple picture can give you a good feeling about near term price direction. SRS just has a nice look and feel to it for a long side trade.....


current channel

I see the outside chance that we could run up to the 895ish channel line though I'd prefer that the smaller channel contain this counter trend bounce....

Wednesday, July 8, 2009

The Deflation trade...

the chart below is an update chart which reveals the relationship between TLT and $comp.
With the green shoots now dead the long bonds can rally and send stocks lower...

My current situation..

call me scared but I reduced my risk which was spread out a little to wide off that bullish diverged RSI on the 10 min bars. That RSI signal offered extra lift into the close and it was time to take down the first leg of profits anyway. I'm out of my put option positions in /ES, OIH, HD and covered my short positions in GS also closed out of SRS, SMN, FAZ and DUG all of which had decent gains in them. I re-entered shorts in /ES as well as long again in SRS and a new position in EEV near the close. The idea was to narrow the focus of my Bearish outlook with just a few positions that I'd be able to manage a little better in the event of any surprise out of Alcoa etc. The further we slide down the more I'll concentrate my Bearish view via /ES on Globex which offers the ability to bail out any time of day or night and as we get into the heart of the earning seasons that offers slightly more peace of mind. I attached the summation index to highlight the near equal distance between down legs which at this point could stall the downward momentum, also RSI is very oversold though none of these things matter in situations where the tape may be about to snap and take us down sharply. So long story short, I am short in the hopes that we are at one of those points in time but some what flexible to bail if I'm wrong...

Tuesday, July 7, 2009

Looking for /ES 840ish on a closing basis...

I'm looking for 840ish minimum on a closing basis over the next 2 days and will be looking for reasons to cover shorts. Ideally we will see a few of those abrupt, deep and relentless moves down into a flat line type affair that allows time to relax and assess before rushing to cover but I will play it as I see it when we get there. Hoping to fatten up my puts a little on a nice $VIX spike before picking them.

Monday, July 6, 2009

/ES channel..

It looks like mini wants one more kiss goodbye at 900ish coming off a bullish RSI bounce.. looking to see the down channel hold...

Saturday, July 4, 2009

The OIL etn vs. OIH etf..


Same chart normalized...

A case of obvious manipulation..

I find it fascinating that those rogue trades over at PVM occurred during the night session on a massive scale where they would have the greatest price impact and at a point where they might destroy the topping head and shoulders pattern. We all know that oil has been the tail wagging the equity dog lately. PVM obviously had nothing to do with it based on how quickly they reported and unwound the positions so the question in my mind is who was this trader working for and why? Regardless the effort failed and oil appears to have broken the neckline and so too will equities.

Friday, July 3, 2009

rediscovered this tonight.. she's incredible


and because just one dose of her isn't enough.. for some reason it was requested (by her?) that this song not be able to embed but here is the link

http://www.youtube.com/watch?v=BvcNtoHwd6Y

fractal update..

Thursday, July 2, 2009

Gold targets


In the Gold market I'm seeing 915ish (.618 fib) as being the most important support area.. which I believe will get taken out...

measured moves...

I'm seeing the potential for a quick flush down to /ES 837ish by tues/wed. of next week on a closing basis based on a confluence of several technical indications...

Wednesday, July 1, 2009

one hopeful indicator

the tick indicator appears to be predicting a bad report tomorrow via it's coiled posture at least out of the gate, we will see how the day goes... I'm hoping for follow through downside action on volume tomorrow.


My biggest concern...

With the cyclical nature of the dollar lately I'm concerned that unless we get a strong surge started soon it may dip lower into the next low cycle target zone which would unhinge my deflation trades in oil, gold, basic materials etc. I've scribbled over the chart below highlighting the recent short term cyclical behavior. The other thing I noticed is the crude oil chart has a short term bullish diverged RSI.


/ES 820ish target..

I'm looking for a target of 820ish once the neck line of this head and shoulders pattern that I'm seeing breaks. I'm looking for gold, oil and basic materials to go down in tandem with stocks..

RSI sell signal tripped...

the /ES is about to break under that uptrend line and follow oil hopefully closing at the lows...